DEMPE analytics tool
Conducting a DEMPE functional analysis can be a lengthy, complex process. You need to take into account many different factors to accurately determine the relative contribution of group entities to the Development, Enhancement, Maintenance, Protection and Exploitation of intangibles. Our quick and easy-to-use DEMPE functional analysis tool makes it so much simpler.

Perform the analysis more efficiently
The tool helps you perform the analysis more efficiently, by carrying out real-time calculations and showing you (as a percentage) how much each entity within your organization contributes to the profit-generating value of a given intangible. This means you can simply and accurately determine what proportion of the resulting income each group entity is entitled to.
A clear breakdown of the information you need
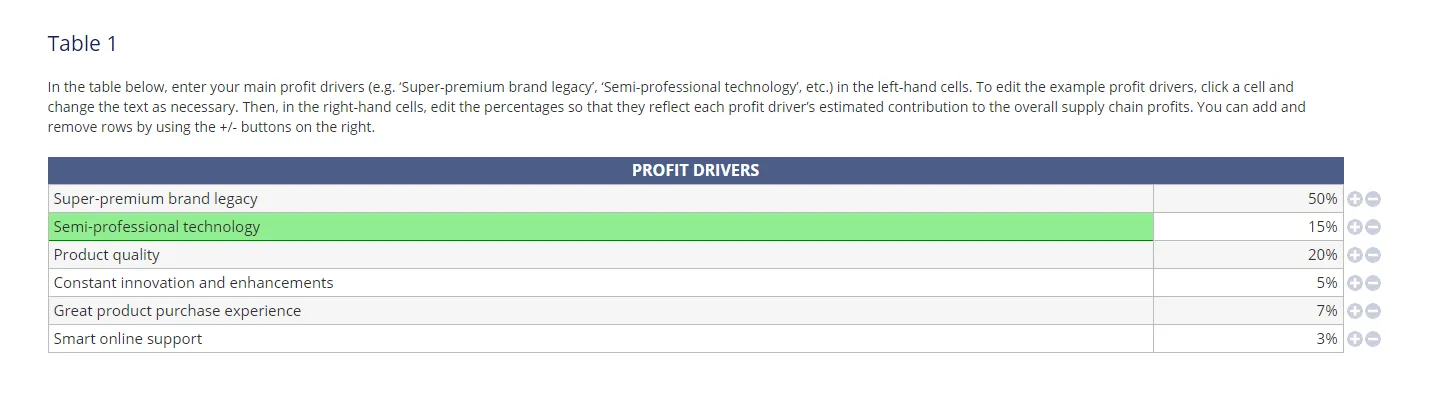
Our DEMPE analytics tool consists of several standardized input tables, which you complete with the necessary information. You save time by answering a standard set of questions, while the tool takes care of the process of estimation and calculation. To make the tool even more user-friendly, the tables are pre-populated with sample data from an example scenario so you know exactly how to use the product.
Intuitive controls
Our DEMPE analytics tool is built to be intuitive. Each input table has a set of instructions outlining what you need to do and explaining how to use it.
Get in touchHow the tool works
-
Enter your data
Our DEMPE analytics tool works by presenting you with a series of tables to fill out. Simply follow the instructions for each table, starting by editing the placeholder information to reflect the profit drivers, DEMPE functions and entities comprising the MNE.
-
Edit cells
It is easy to change the information in the cells. Just click on a cell and you will be able to delete/modify the text.
The same is true for numerical data. Simply click on the cell to edit the information.
-
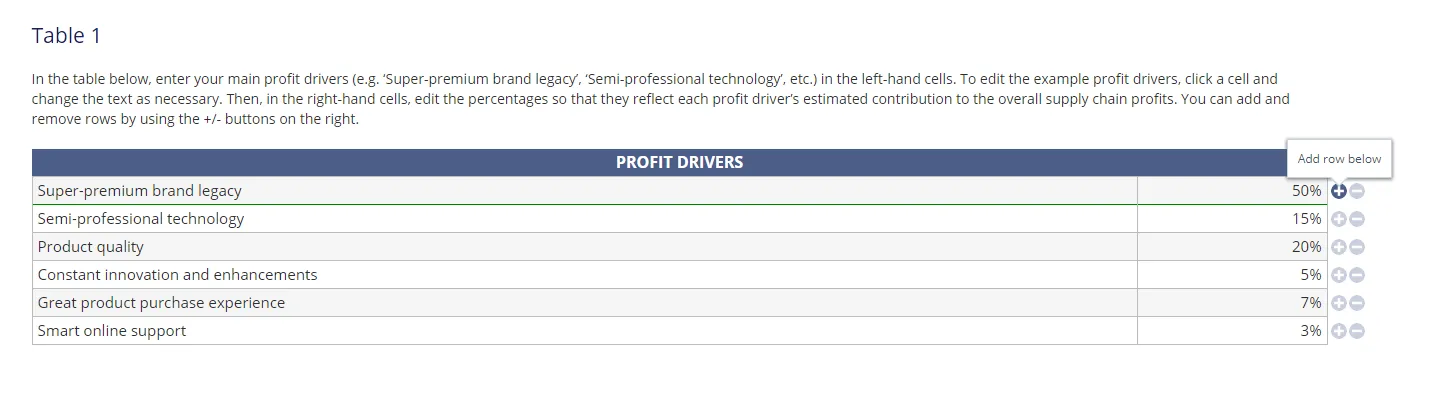
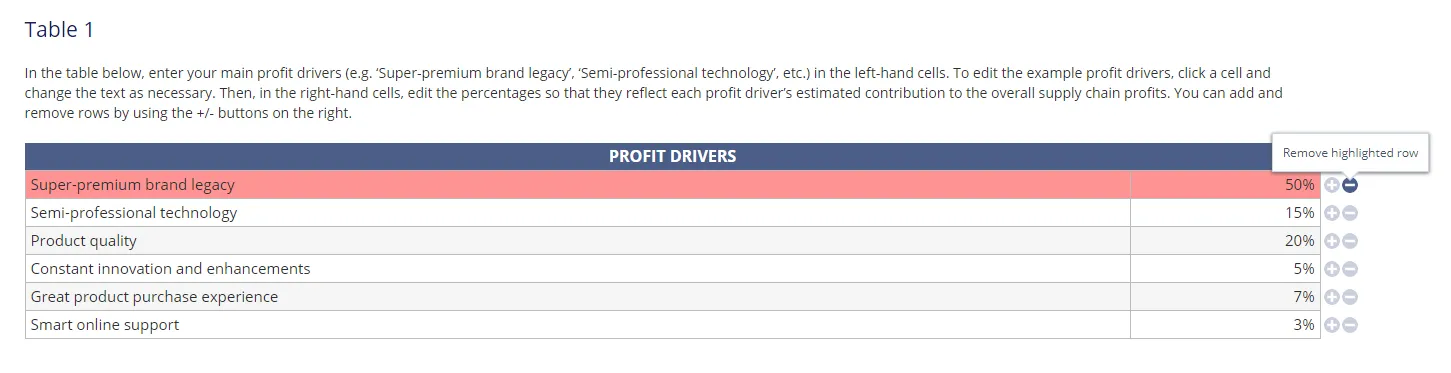
Add and remove rows
If you need to add or remove a row, use the +/- buttons, located to the right of the table.
-
Adjust the circles
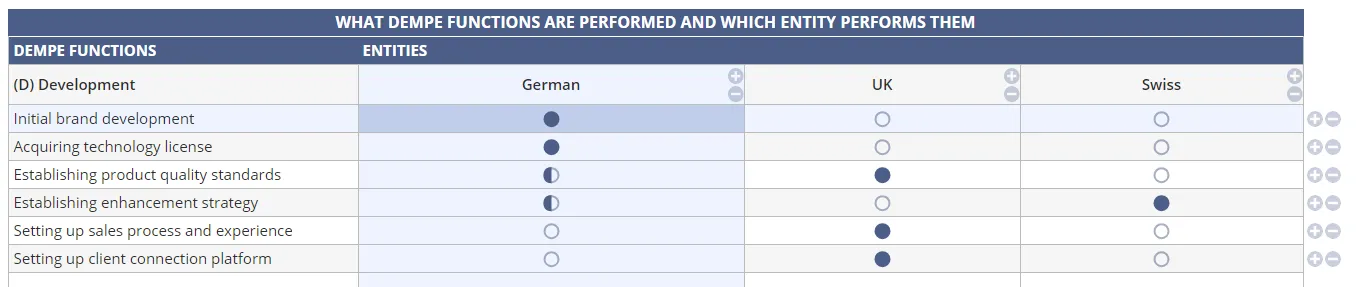
In Tables 2 and 3, you can edit the circles to show which entities contribute to – and to what extent – the performance of DEMPE functions (Table 2) and how these functions correlate with the profit drivers (Table 3).
An empty circle means there is no contribution/correlation, a half-full circle represents partial contribution, and a full circle represents full contribution.
If you need to add or remove a row or a column, simply use the +/- buttons, located to the right of and at the top of the table.

-
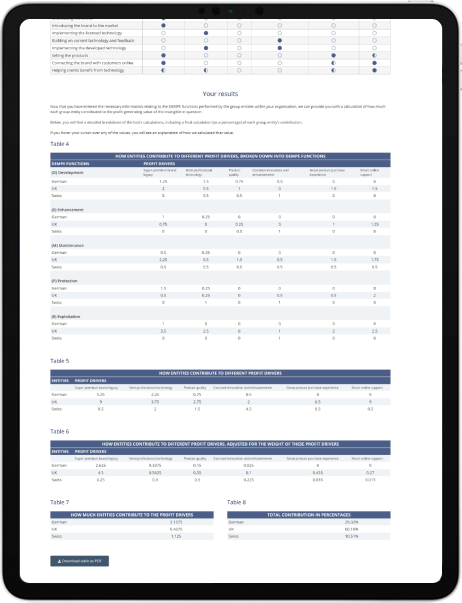
View your results
Once you have filled in the tables, you can scroll to the bottom of the page to see the results of the analysis.
All calculations are carried out in real time. If you want to know how a certain value was calculated, simply hover over the number to see a detailed pop-up explanation of the calculation process.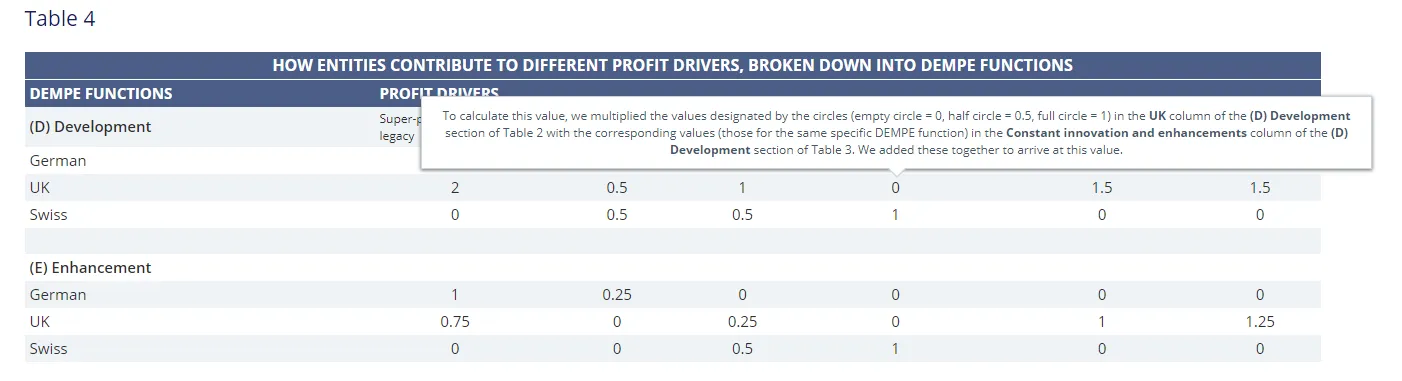
Start using the DEMPE analytics tool today
Our DEMPE analytics tool is a quick and easy way to get data for your functional analysis. It takes complex calculations off your hands and provides you with accurate, insightful results.
Ready to try it yourself? Simply log in to your RoyaltyRange account and click on ‘DEMPE analytics’ in the menu bar.
If you don’t have an account yet, join us today to get started.
Why RoyaltyRange?
RoyaltyRange is a global transfer pricing data provider known for providing in-depth, high-quality data. Our databases are used by over 1,000 clients in 70+ countries – from tax authorities and international consulting companies to multinational enterprises. We have four databases, covering private company financials, royalty rates, service fees and loan interest rates. We also have tools for benchmarking, DEMPE and credit rating estimation.